Pick a stage
The route profile sets the race logic: punch, climbs, time trial, or team collective strength.
Choose a Tour de France stage, challenge the model with your rider pick, compare contenders head-to-head, or test how well a team matches the stage profile.
This interactive Tour de France winner predictor is built for fans who want to explore race scenarios instead of reading a static list of favourites. Select a stage and the tool compares rider strengths, team support, and route characteristics to display the most suitable contenders for that profile.
You can use the stage predictor to scan likely winners, test a personal rider pick, compare two riders on the same route, or evaluate which team looks best matched to the terrain. The app is designed to support Tour de France prediction searches, stage-by-stage analysis, and fast interactive comparisons while keeping the scoring engine server-side.
The current release uses a pilot dataset that will be expanded over time. Its purpose is to create a playful, explainable Tour de France prediction experience that can grow with richer rider, team, and stage information.
How the Tour de France Predictor Builds Each Simulation
Each prediction is generated by combining multiple layers of race data: rider strengths, bike characteristics, team performance, stage demands, weather conditions, race format, and scenario adjustments chosen by the user.
This data-driven system is coupled with a powerful AI engine to cross-reference these factors and build a race-specific simulation rather than displaying a generic ranking.
The result is a dynamic prediction experience where every Grand Prix scenario can produce its own contextual outcome.

The same server-side model powers all four modes below. Pick a stage, launch the scan, and watch the results arrive.
A compact rotating selection of cycling posters to explore between predictions.
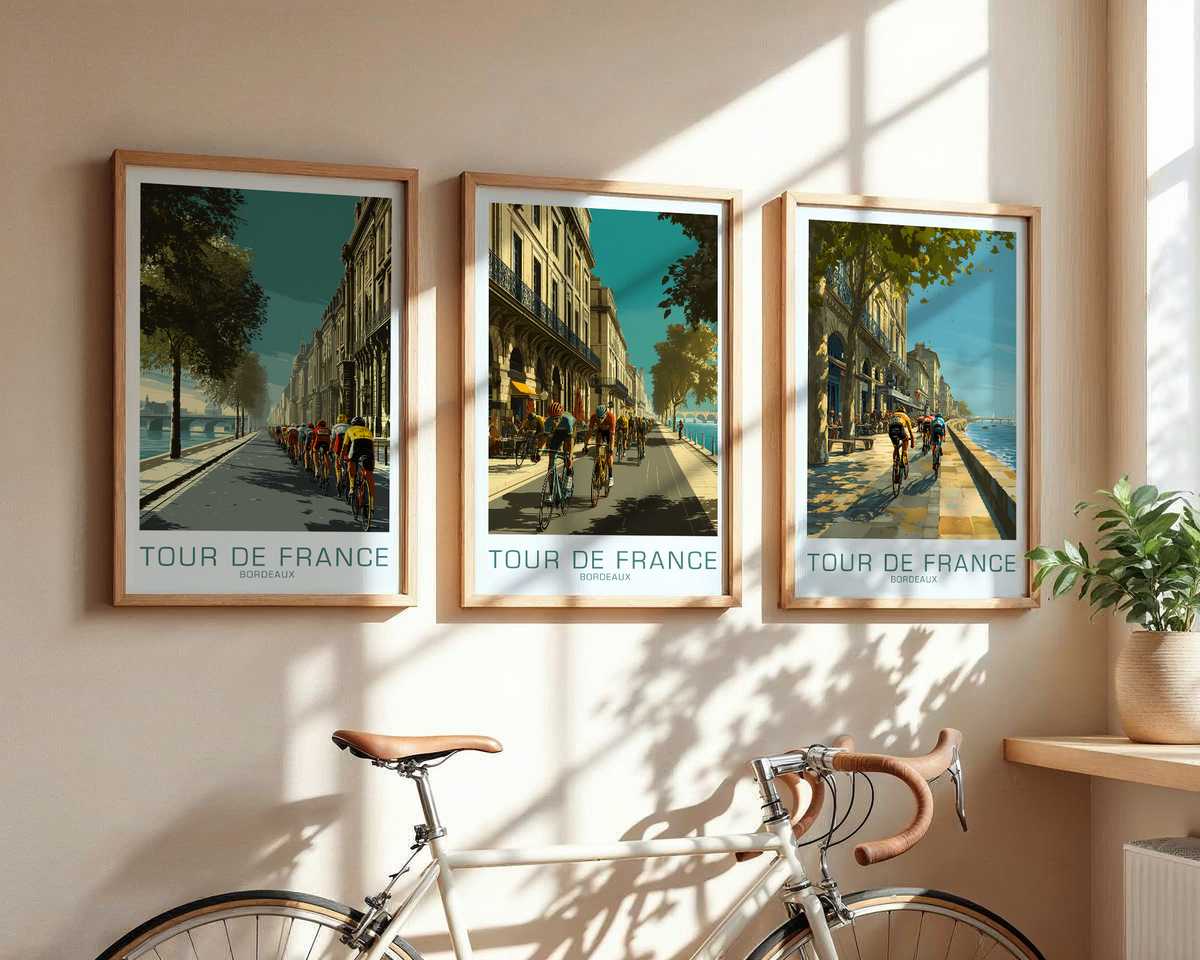 Bordeaux Vintage Tour Poster: How Local Heritage, Archive Aesthetics and…View poster
  Vintage Cycling Poster: The Col de la Madeleine as Epic AscentView poster
  Chambéry Bike Frame Artwork: How the Race Machine Structures the PosterView poster
  Poster Tour de France: Toulouse, Heritage and the Archive AestheticView poster
  Plateau de Beille Vintage Print: How a Tour de France Poster Turns Slope and…View poster
  Tour de France poster: Nice, vintage memory and the deeper value of heritage…View poster
Launch a stage prediction to reveal the top riders, top teams, and the profile favoured by the model.
Select a rider to see whether the predictor sees an elite contender, an outsider, or a risky pick.
Compare two riders on the same stage and reveal which one holds the model advantage.
Choose a stage and a squad to uncover its model ranking, strengths, and best suited rider.
A small rotating poster strip selected automatically at build time.
 Champs-Élysées Poster: Capturing the Ceremonial Finish of the Tour de FranceView poster
  Briançon as Stage: Bicycle Frame Art That Makes a Mountain Town Race-ReadyView poster Plateau de Beille Vintage Print: How a Tour de France Poster Turns Slope and…View poster
  Peloton Poster — Mount Ventoux: The Sense of Ascent, Altitude and Prolonged…View poster
  Aubisque Moment: Bicycle Art Prints that Capture a Climbers' DuelView poster
  Retro Tour de France Posters: The Col d’Aubisque as an Epic Ascent in PrintView poster
The app combines stage type, rider traits, and team support scores through a model hosted in a Cloudflare Worker. The visible page stays light; the prediction engine itself remains server-side.
This first release is intentionally a pilot. It gives us the full interaction system now, then the dataset can grow toward the complete Tour start list and all 21 stages.
The route profile sets the race logic: punch, climbs, time trial, or team collective strength.
The Worker calculates scores securely and returns only the result payload needed by the page.
Animated score bars, rankings, and reason snippets make the result easy to scan and share.